credit Ratings 101
As the world’s leading provider of credit ratings, S&P Global Ratings’ credit risk analyses, research and insights support the growth of liquid debt markets worldwide. Project Simplify is an internal technology initiative to provide employees with a simpler, standardized and better controlled analytic ratings process facilitated by a single, intuitive workflow platform. Project Simplify will increase automation to alleviate some of the manual burden of the ratings process, reduce controls liability on analysts and also enhance the opportunity of talent development.
Credit ratings are opinions about credit risk. S&P Global Ratings express their opinion about the ability and willingness of an issuer, such as a corporation or state or city government, to meet its financial obligations in full and on time. These ratings can also speak to the credit quality of an individual debt issue, such as a corporate or municipal bond, and the relative likelihood that the issue may default.
Some credit rating agencies specialize in analyzing the credit risk of issuers and individual debt issues. They formulate and disseminate ratings opinions that are used by investors and other market participants who may consider credit risk in making their investment and business decisions. Credit rating agencies assign ratings to issuers, such as corporations and governments, as well as to specific debt issues, such as bonds, notes, and other debt securities.
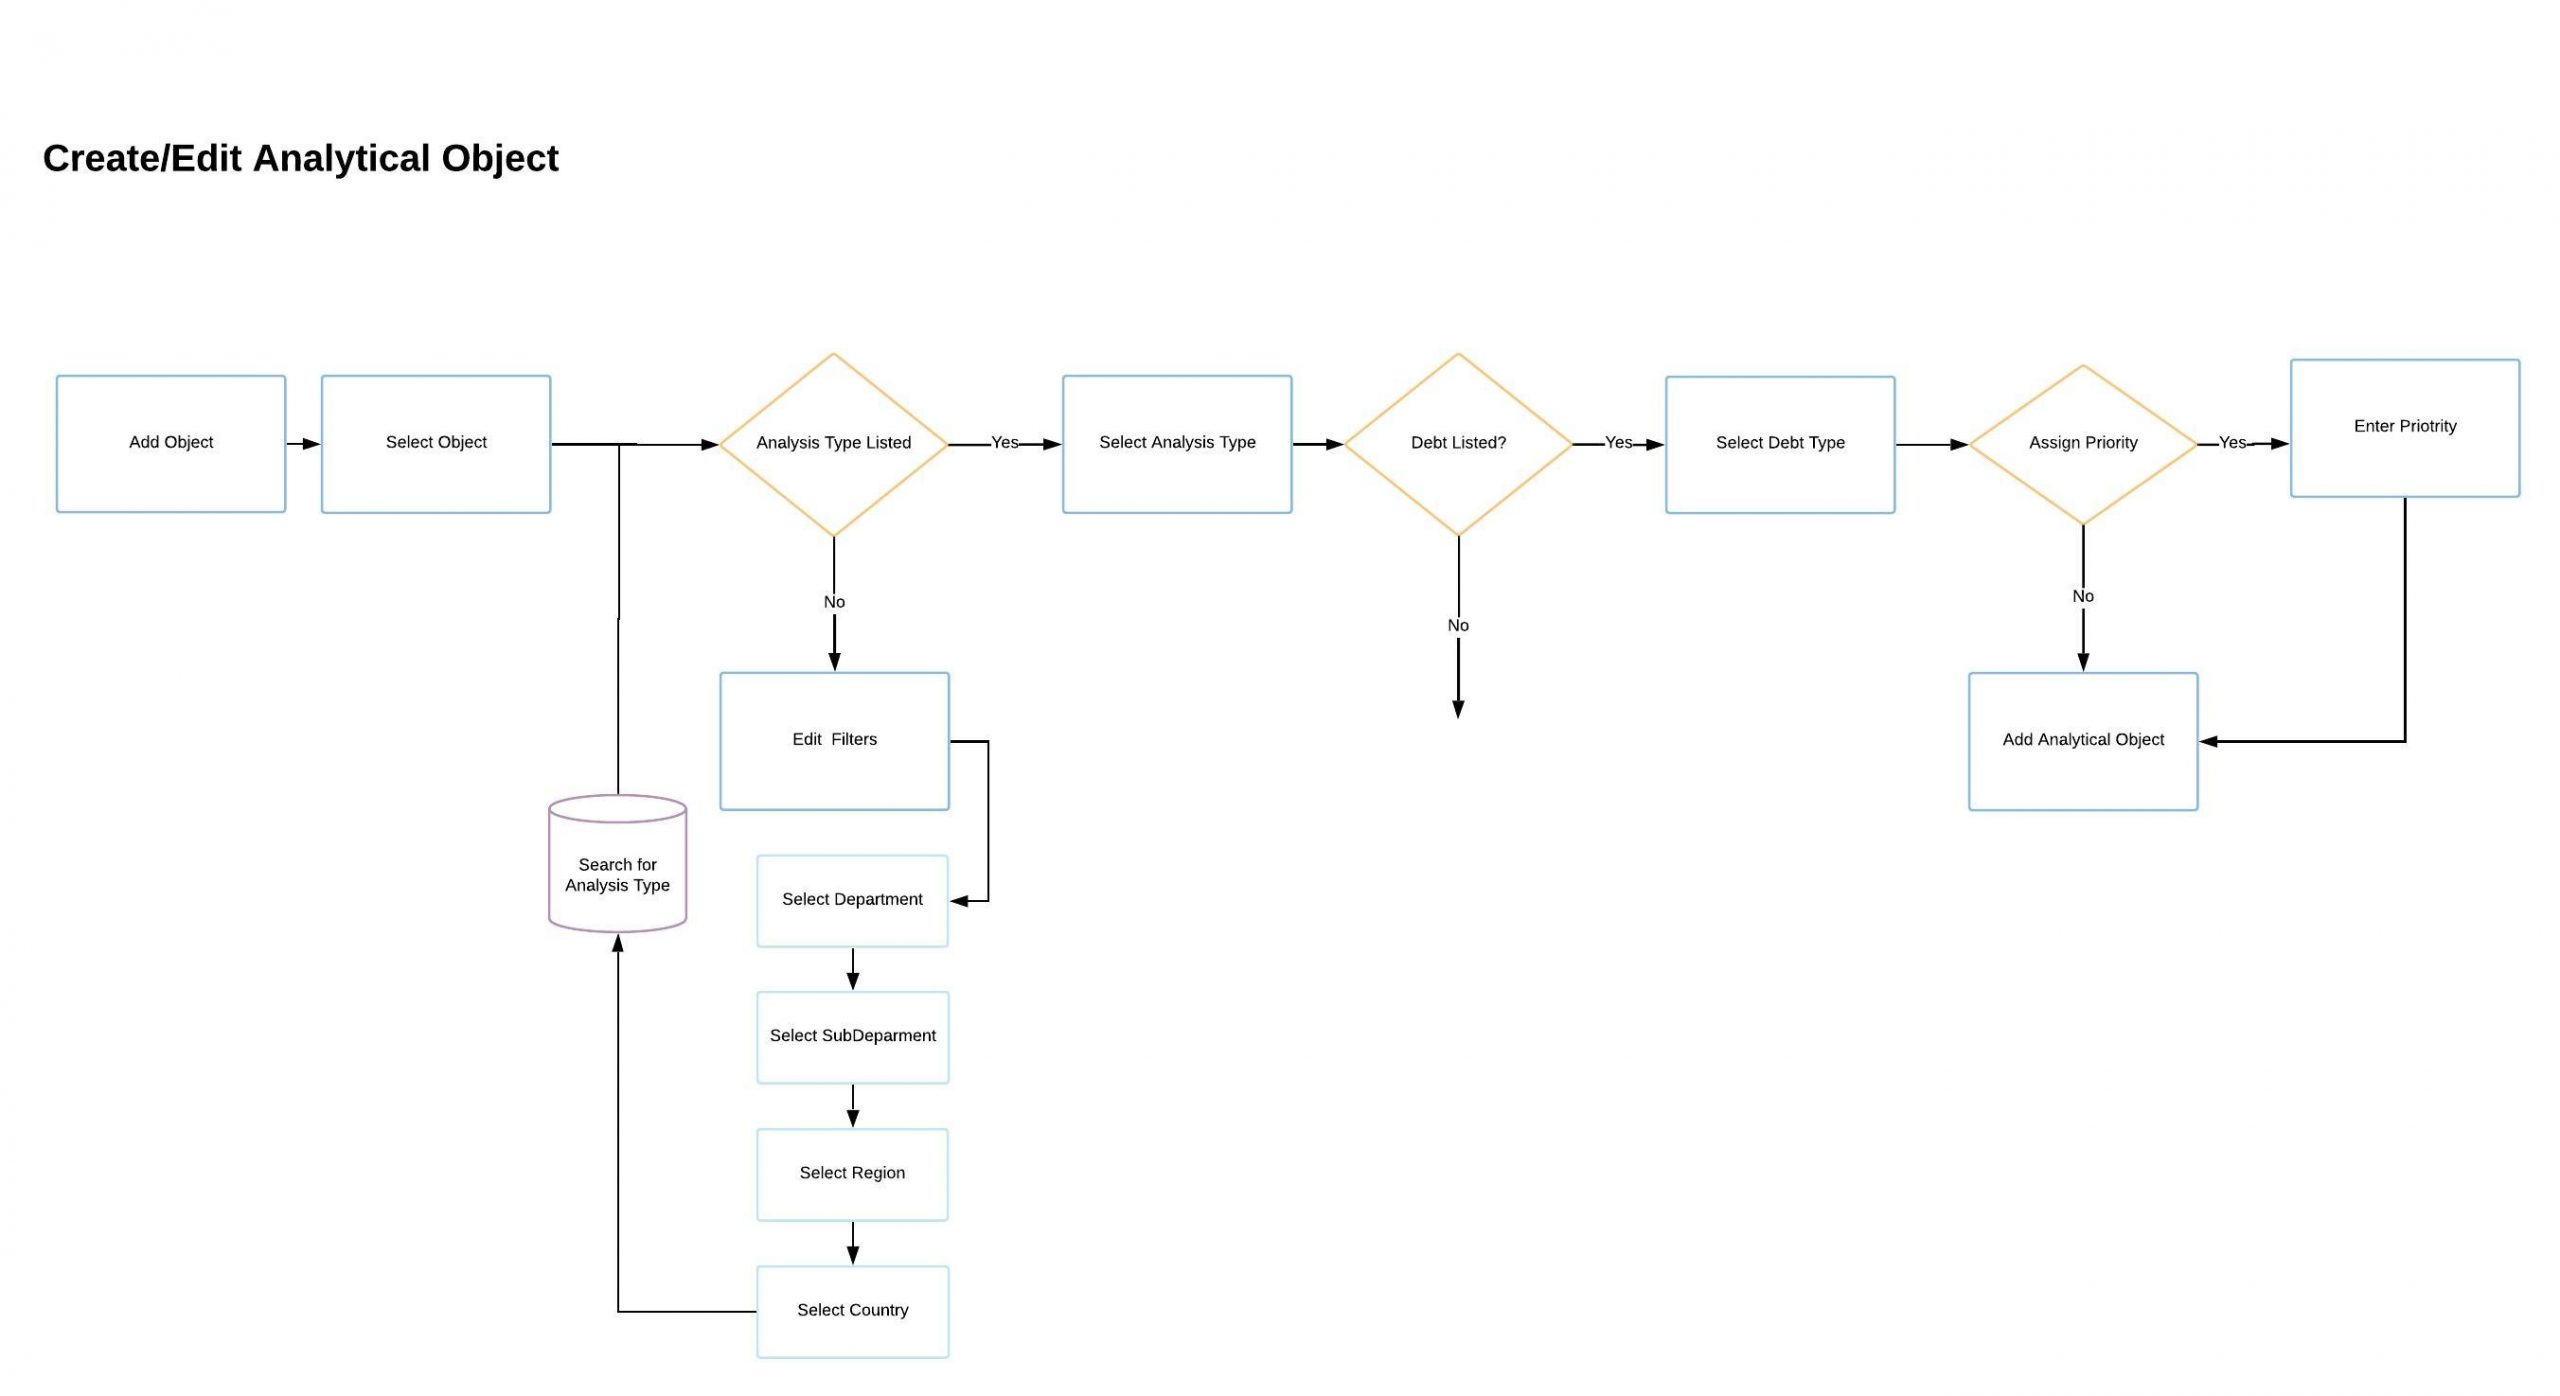
At S&P Global Ratings corporations, states or city governments are referred to as Primary Analytical objects. Creating analytical objects is part of the rating process required for the services S&P Global Ratings offer:
Process/Experience
I joined this project as a consultant and found that it was running two years behind. The technology stack they decided to use is called PEGA, a cloud software that promises the ability to scale automation allowing business to transform operations into automated workflow processes.
I was tasked with leading the design side for one of the main features in the project: Creating Secondary Analytic Objects.
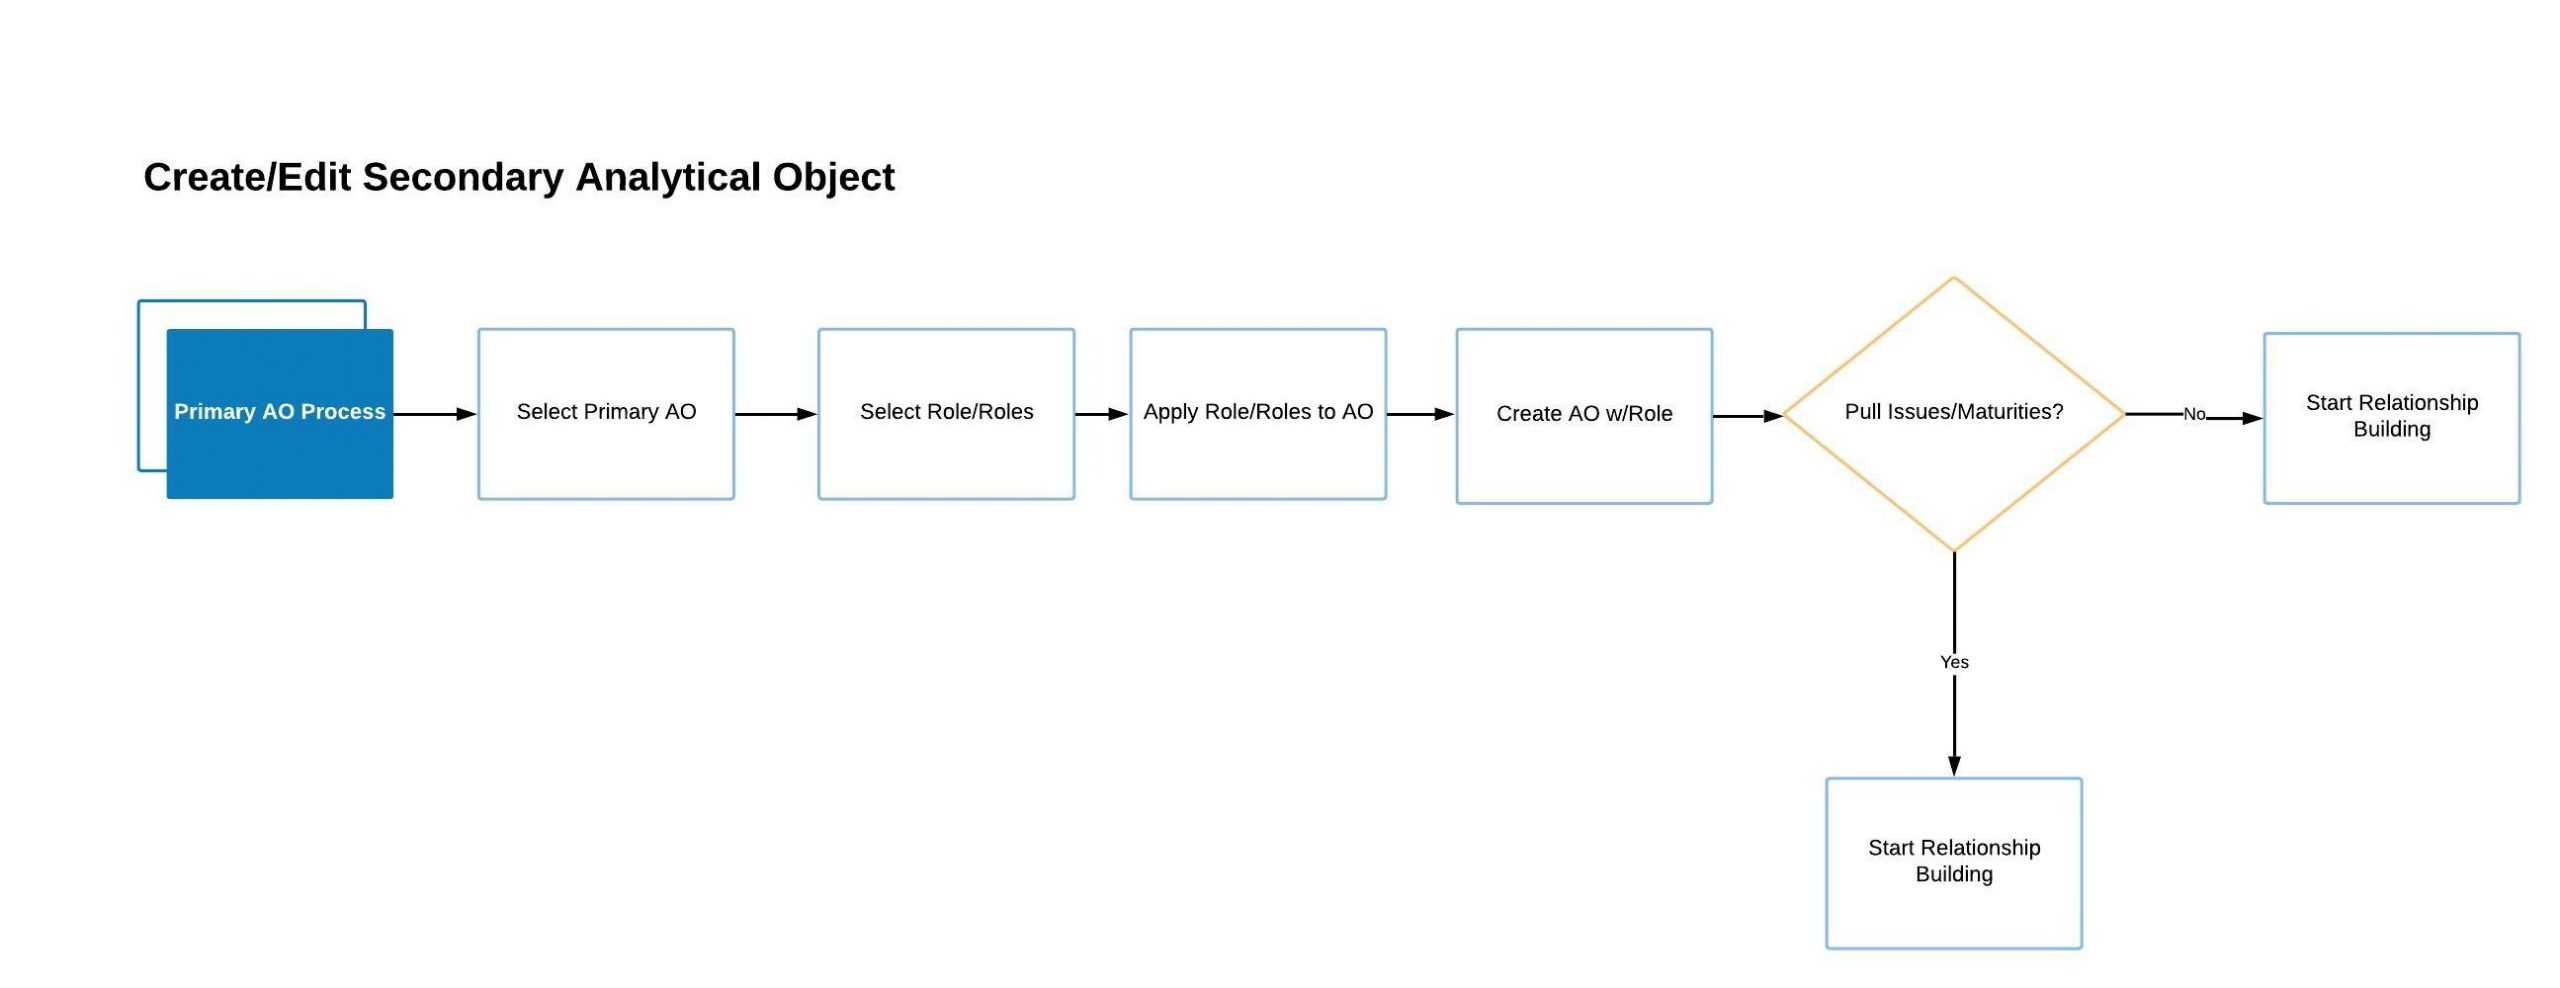
Depending on the type of rating an analyst is trying to produce the next step in this process is the creation of Secondary Analytical Objects. In short: a Secondary Analytical Object is composed of issues and/or debts and the entities, whether those are government or corporations, that play a role in the issue. Analysts use Secondary Analytical Objects to get a full picture of the financial responsibilities and standings of organizations.
Project Status
The first iterations of the design revolved around massive grid-like structure that would allow analysts to identify all entities, debt issues and participants and their dependencies across departments. This concept was inspired by the analysts work with excel sheets. The idea was to provide users with a way of “building” Secondary AO Structures.
The technology implemented to develop Project Simplify presented many limitations regarding the amount of data allowed on screen at one time and the processing time to ping and receive information from outside sources. The data sets that populate this feature were in the millions and the grid concept presented a massive technology roadblock since it did not support showing that amount of data on screen.
Design Solution
The technology implemented to develop Project Simplify presented many limitations regarding the amount of data allowed on screen at one time and the processing time to ping and receive information from outside sources. The data sets that populate this feature were in the millions and the grid concept presented a massive technology roadblock since it did not support showing that amount of data on screen. The proposed design made use of existing design system components to reduce the amount of development and integration.
Based on conducted interviews with both the business stakeholders and users at different level, we aim for this solution to:
- Real time data validation within the system. Existing data would be made available once the workflow suite went live.
- Enable the user’s ability to view all the data pertaining a specific issue.
- Integrate the process of data validation and new data creation into the same workflow.
After creating primary analytical objects users had the option to create secondary analytical objects and build the relationships necessary to complete the analysis required.
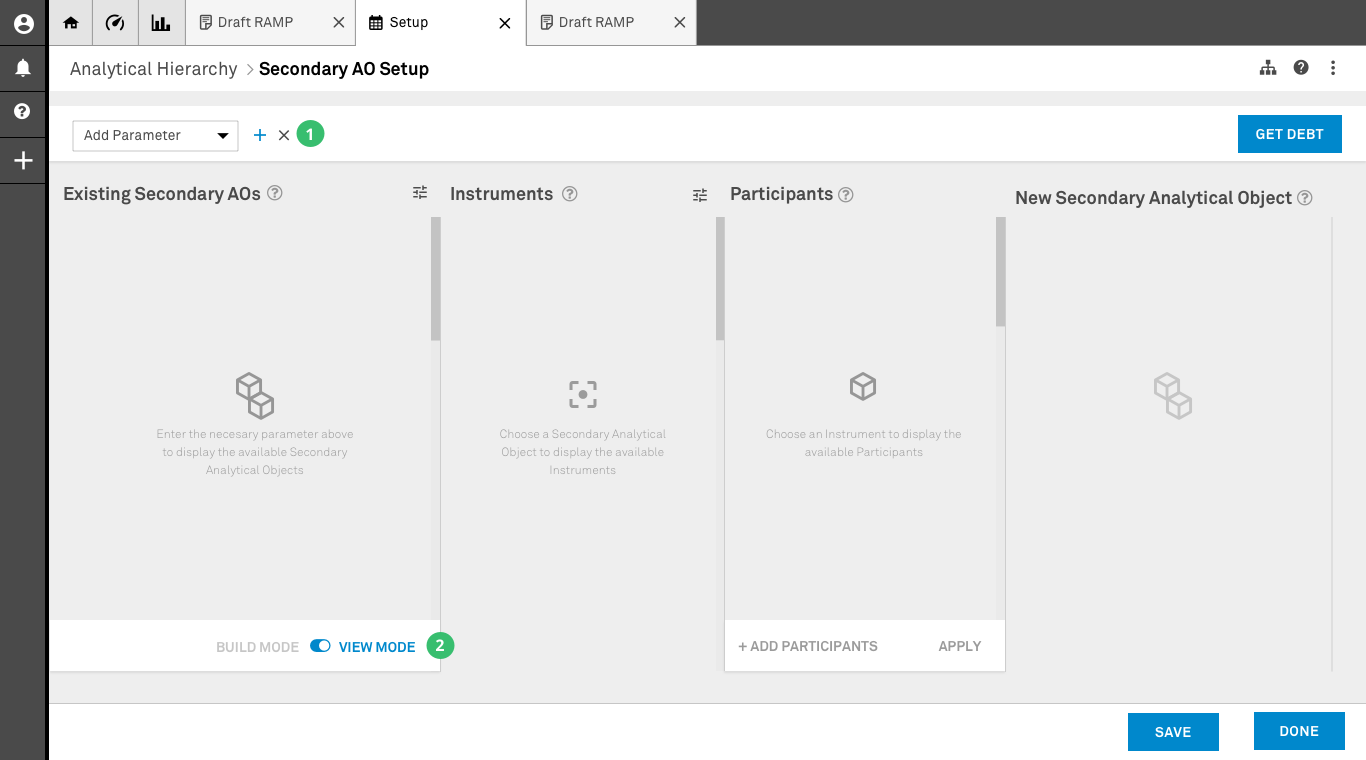
1. Parameter Bar: Users would be able to select different parameters within the system in order to do an initial filtering of the data. With this feature we aim to tackle some of the data loading limitations of the application.
2. Build/View Mode: There are two modes in which the user can interact with this page. In Build mode users can use existing data to create new relationships. Once a new relationship is built the system will cross-reference the data with existing data and eliminate any relationships that don’t match. In View mode users are allow to access the data contained in any existing set without making any changes.
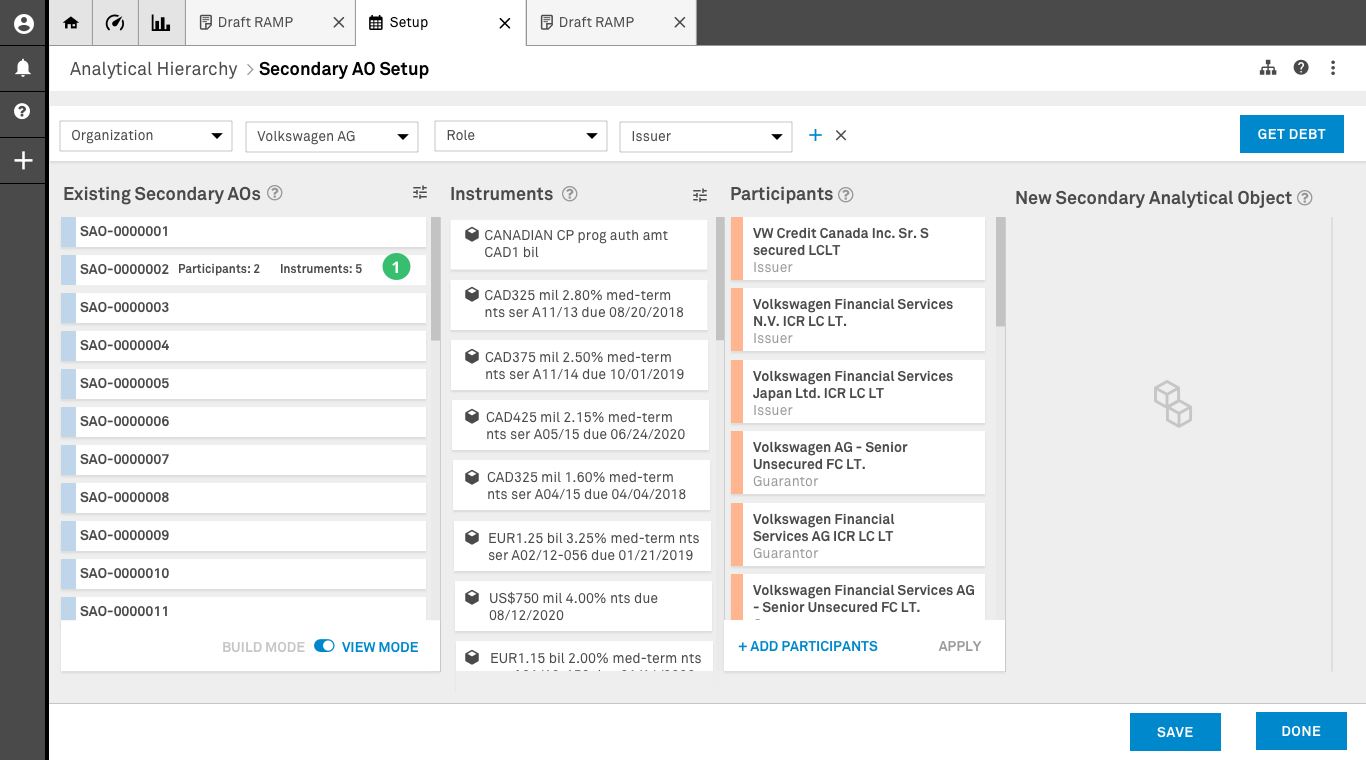
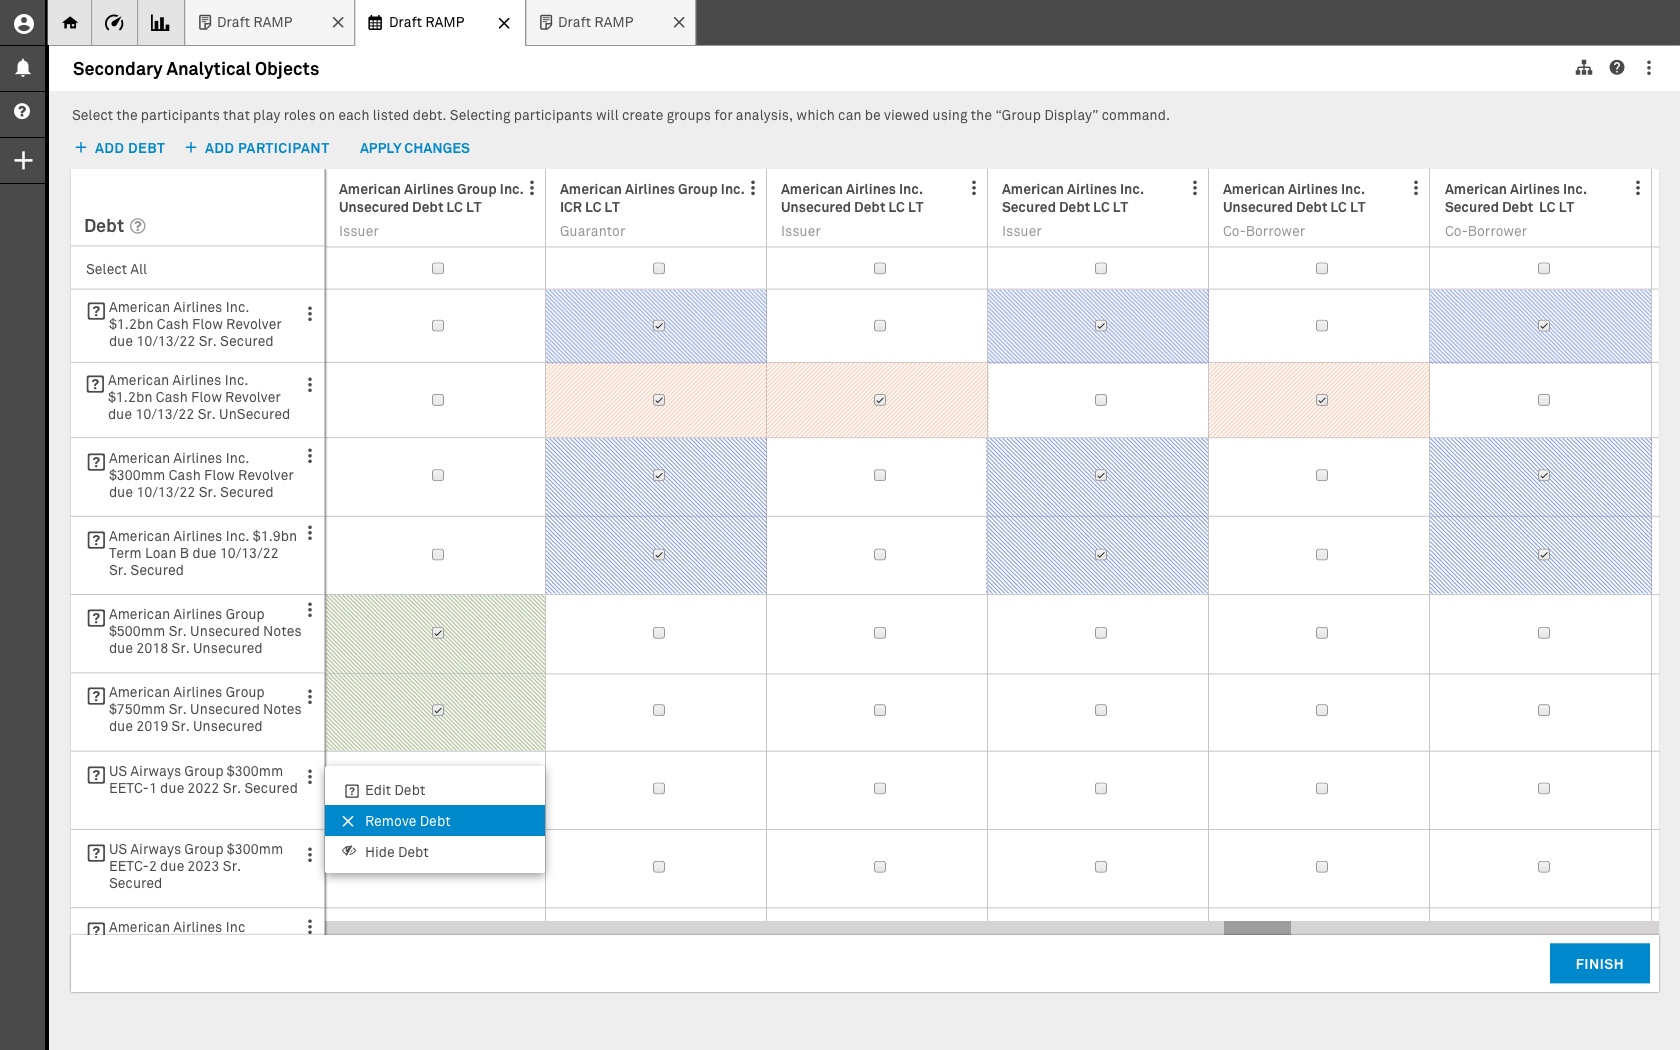
Data has been pulled using the parameters selected by the user. In this screen user is operating in View Mode.
1. Existing SAO: The existing system doesn’t a have a way of displaying in a condensed way all the existing relationships. This container was proposed as a mechanism to pull all the necessary data without crashing the application.
Once an item in this column is selected the system will display the elements that are contained in the columns that correspond to the elements (Instruments and Participants).
No changes can be made to any of these elements and their association while in view mode. By not making any changes to an existing relationship, users effectively validate the data once is saved.
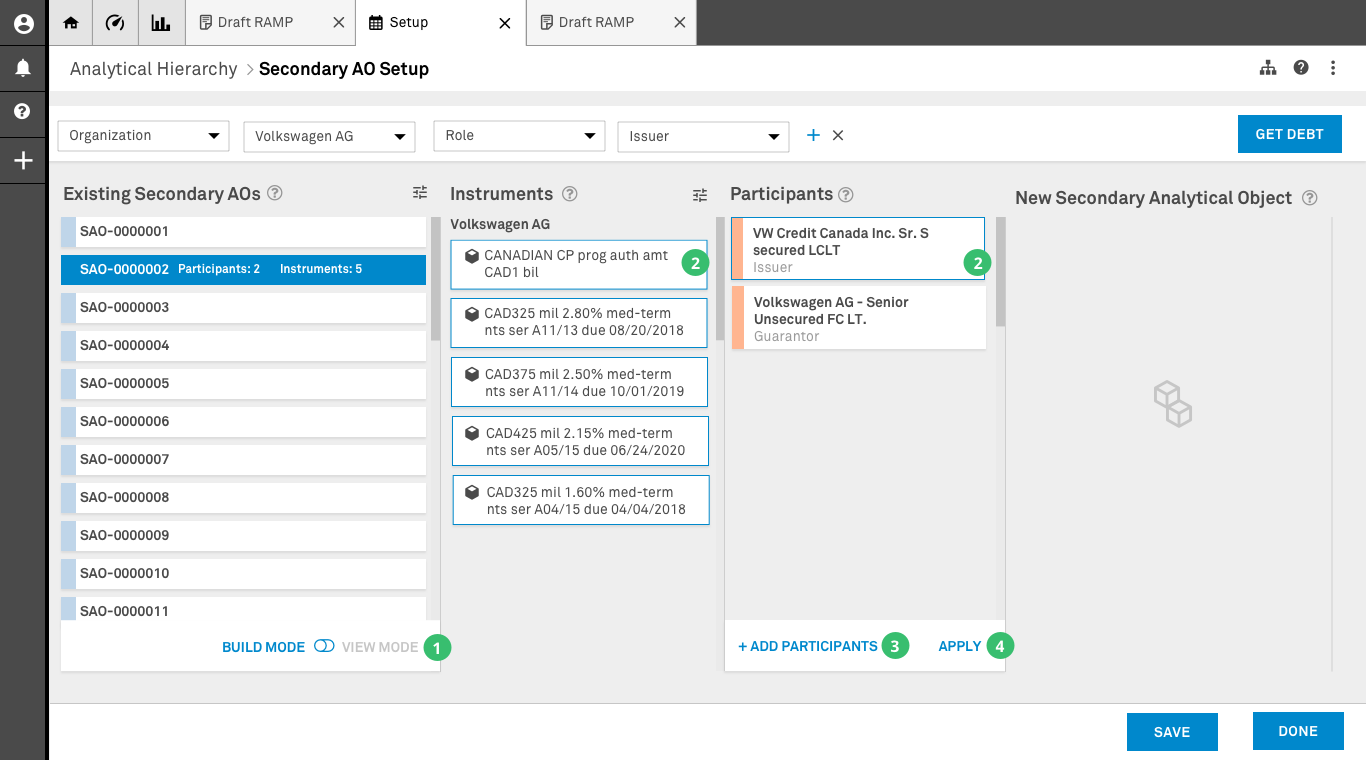
Data has been pulled using the parameters selected by the user. In this screen user isoperating in Build Mode.
1. Build Mode: The user has switch to Build Mode. this enables all the elements on columns two and three to de selected. This mode allows the user to create new relationships using the existing SAO as a starting point.
2. Selection: The user has selected some of the components of the existing SAO to create a new relationship. Once this is submitted to the system not only will a new SAO will be created, but the but the old SAO will be modified. The elimination of an existing SAO is dependent upon proprietary rules.
3. Participants: If a participant that plays a role within this new relationship is not present, the user has the option to add this participant in a manner that doesn’t affect the search parameters entered in the parameter bar. This feature is only activated in build mode.
4. Apply (validation): Once the user has selected and added all the instruments and participants necessary in the are relationship the apply option is pressed to create a new secondary AO. This feature is only activated in build mode and saves a front end only version of the new SAO.
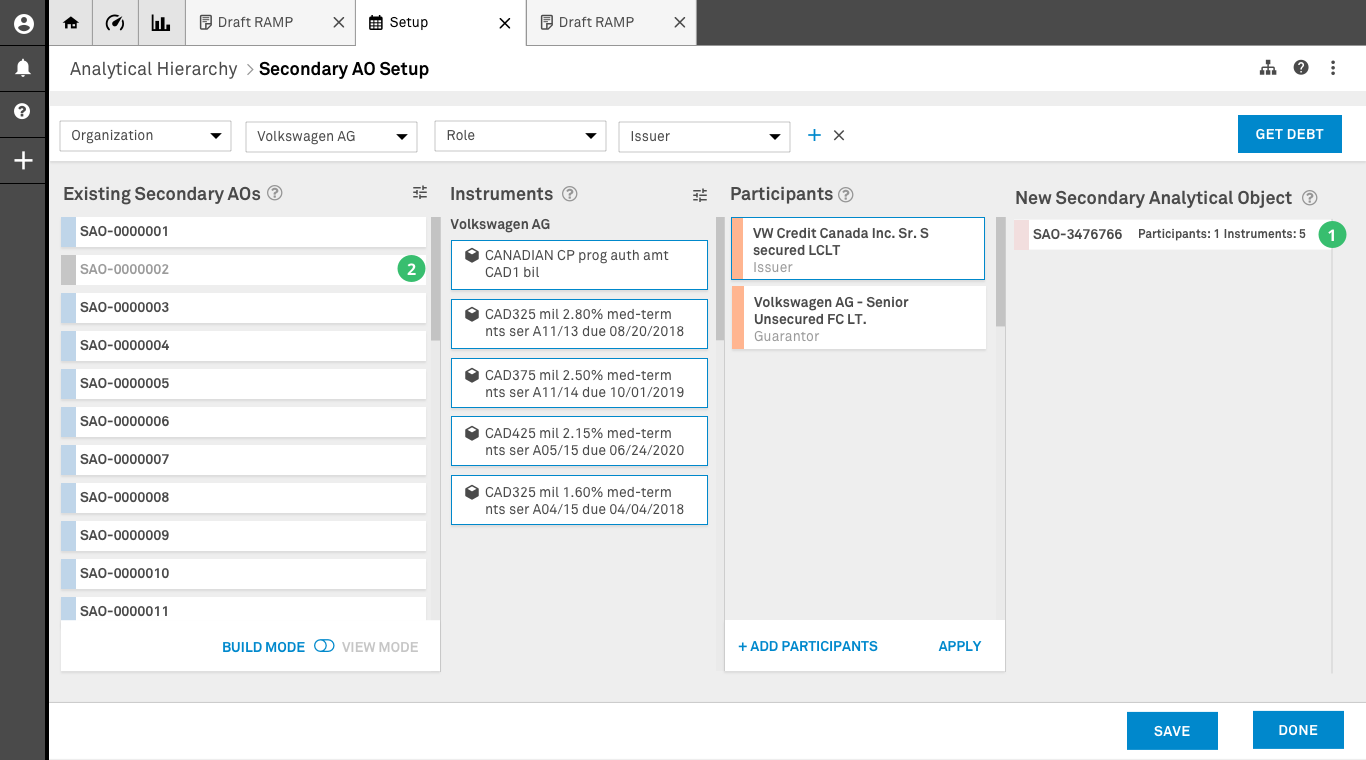
New Secondary Analytical Object Creation
1. New SAO: A new Secondary Analytical Object has been created. If at any point within view mode the user selects this card, the items in columns two and three will change to reflect the elements inside this new SAO.
2. Existing SAO: If the creation of a new SAO invalidates the data in the existing SAO after cross-referencing, the existing SAO will be greyed out on the screen. This feature allows the user to have a sense of the work that has been done on screen.
Lessons & Outcomes
The technology implemented to develop Project Simplify presented many limitations regarding the amount of data allowed on screen at one time and the processing time to ping and receive information from outside sources. The data sets that populate this feature were in the millions and the grid concept presented a massive technology roadblock since it did not support showing that amount of data on screen. The proposed design made use of existing design system components to reduce the amount of development and integration.
Based on conducted interviews with both the business stakeholders and users at different level, we aim for this solution to:
- Real time data validation within the system. Existing data would be made available once the workflow suite went live.
- Enable the user’s ability to view all the data pertaining a specific issue.
- Integrate the process of data validation and new data creation into the same workflow.
After creating primary analytical objects users had the option to create secondary analytical objects and build the relationships necessary to complete the analysis required.
1. Parameter Bar: Users would be able to select different parameters within the system in order to do an initial filtering of the data. With this feature we aim to tackle some of the data loading limitations of the application.
2. Build/View Mode: There are two modes in which the user can interact with this page. In Build mode users can use existing data to create new relationships. Once a new relationship is built the system will cross-reference the data with existing data and eliminate any relationships that don’t match. In View mode users are allow to access the data contained in any existing set without making any changes.